
AUTOMATE AND MONITOR KEY PROCESSES AND PERFORMANCE INDICATORSML
Minitab Connect
Monitor. Automate reports to share and track information for meaningful business intelligence. Instant alerts communicate changes requiring action or a deeper dive into your data.
Automatisera samt övervaka processer och nyckeltal.
Why continue building the same report and analysis every day, week or month? Use Minitab dashboards to set-up your report to run regularly and be shared easily with those that need to see it.

Access
Access and integrate your data from a variety of sources. Stop wasting precious time formatting and blending CSVs and spreadsheets. Minitab Connect allows you to set-up your analytics dashboard once and automatically updates as your data changes.

Self-service data preparation tools empower users – from data scientists to business analysts – to quickly and interactively, profile, curate, enrich, and shape diverse datasets using a spreadsheet-like interface.
Because the platform stores data resources in a centralized database, users can easily access and explore their data without risking data quality or security.
Data preparation steps can be shared with other users as repeatable workflows, eliminating repetitive data setup processes and maximizing productivity.
Seamless, direct access to Minitab® Statistical Software enables one-click delivery of prepped data for in-depth analysis.
Prepare

Visualize
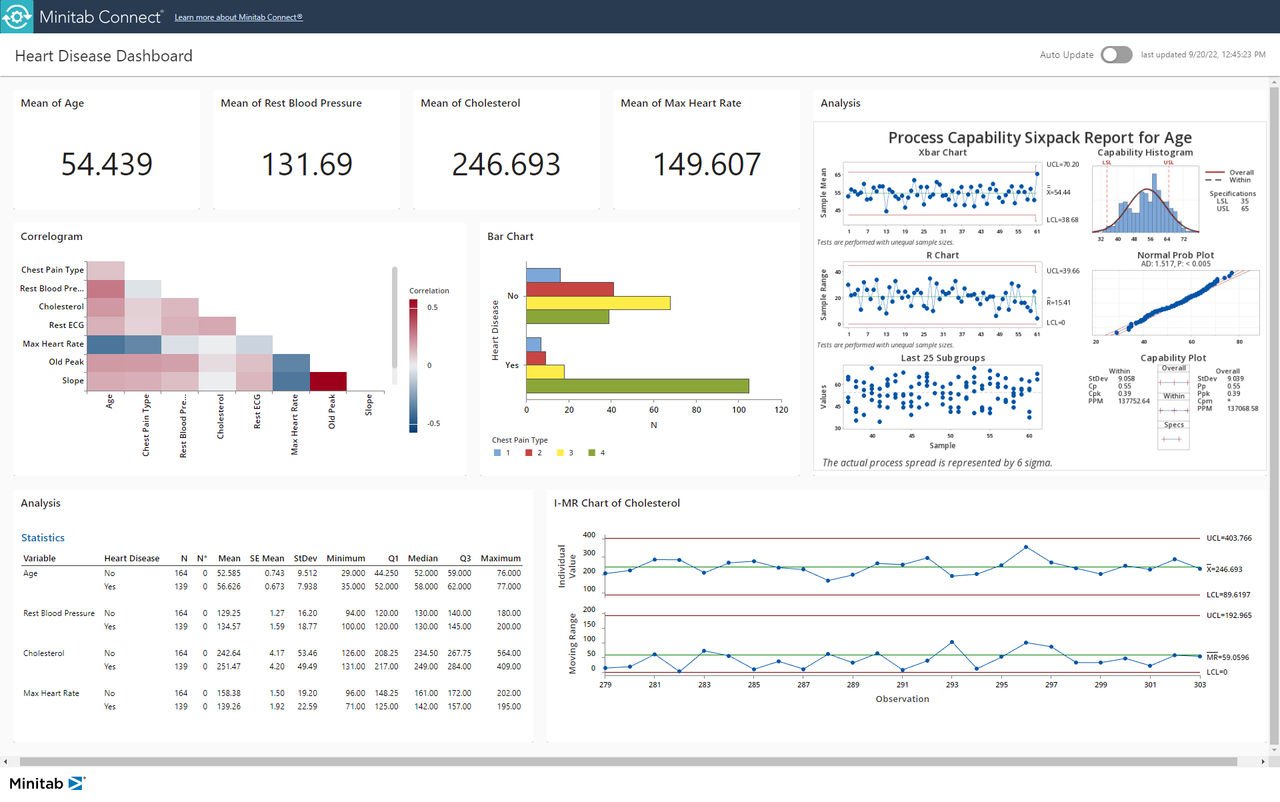
Dynamic, real-time visualizations with interactive elements allow users to explore data and develop deeper insights.
Dashboarding tools include highly flexible, configurable design and formatting options to facilitate meaningful reporting.
Data visualizations and dashboards can be shared - securely - with relevant stakeholders across the enterprise and beyond.
MINITAB STATISTICAL SOFTWARE
Vill du veta mer om Minitab Connect?


