MINITAB ANALYTICAL SOLUTIONS
Minitab’s Manufacturing & Industrial Solutions
With Minitab, you can improve quality, increase production yields, and bring products to market faster. Our solutions can predict changes to your process or fluctuations in demand to eliminate problems before they occur. And that means you can prevent downtime and reduce defects!
With Minitab’s wide array of solutions for manufacturing, we can help you get started on improvement projects or partner with you for digital transformation initiatives.
Identify Inconsistencies in Production
Learn how Minitab helped a leading steel manufacturer identify inconsistencies in manufacturing and implement quality controls, which led to improved performance. Using the DMAIC methodology, the project team studied their wire-making process and improved the cooling process at the Laverton Rod Mill. The operators now have better control of laying head temperature, and Minitab analysis confirmed that the improved cooling process has significantly reduced rod scale weight.
Improve Quality with Minitab
For over 50 years, Minitab has been the market leader in quality analytics for manufacturing and industrial organizations. Improving quality can be achieved using a variety of quality tools which can be found in Minitab Statistical Software, Minitab Workspace, and across Minitab's solutions.
Develop New, Sustainable Manufacturing Methods
Learn from Signify (formerly Philips Lighting), the world's leading lighting manufacturer, and get best practices for developing new manufacturing methods. Harness the power of data to demonstrate that recycled materials or 3D printing will make reliable products, including measuring time to failure.
Predictive Analytics for Manufacturing
Learn how one of the world’s leading home appliance makers saved millions of dollars by incorporating Minitab’s predictive analytics tools into their improvement initiatives.
Predictive & Preventive Maintenance
Predictive and preventive maintenance begins with understanding the reasons behind equipment failures. Using Minitab solutions, insight into these failures is available with a click of a few buttons. Get enabled to build your own predictive and preventive maintenance program!
Increase Production Yields
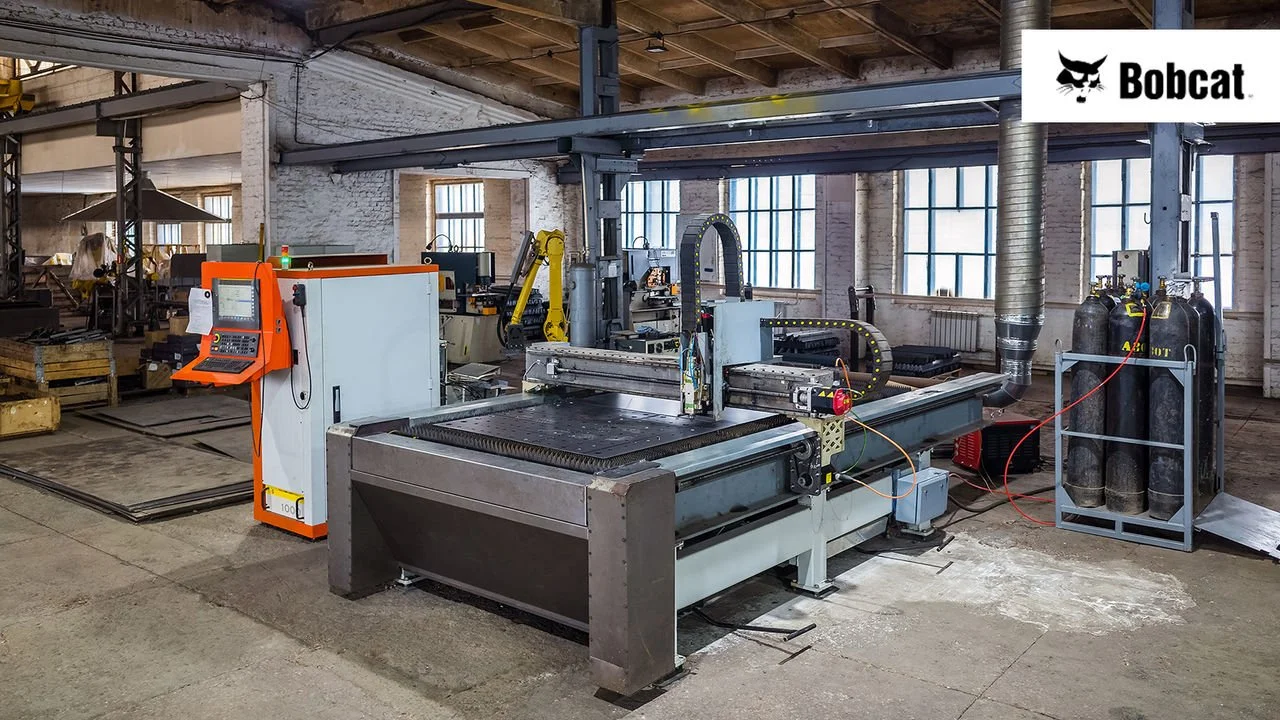
Learn how Bobcat increased production by 20% while improving performance and quality. This eliminated the need to purchase additional manufacturing equipment, resulting in nearly a 1-million-dollar savings in new equipment installation.
4 data-driven ways you can eliminate product mistakes
In this blog, we will explore how Minitab supports the teams and organizations that work in cosmetic manufacturing.
MINITAB STATISTICAL SOFTWARE VERSION 22
Utökade statistiska funktioner. Förbättrad AI. Utvecklade visualiseringar.
Den senaste versionen av Minitab Statistical Software kan göra din dataanalys smartare, snabbare och enklare än någonsin. Få tillgång till utökade statistiska funktioner, förbättrade AI-möjligheter och utvecklade visualiseringar med Minitab Statistical Software 22.
Utökade statistiska funktioner
Nonparametric Capability Analysis
Nonparametric Capability provides a robust solution for evaluating the capability of a process where no distribution or transformation is appropriate.
EMP methods for Gage Studies
Evaluate Measurment Process (EMP Crossed) provides the tools to assess the process variation in a measurement system with crossed designs using the preferred Wheeler’s EMP criterion.
Improved 1-proportion Test
Several imporvements have been made to the 1-proportion Hypothesis Test and Confidence Interval commend.
Förbättrad AI-funktion
Automated Capability Analysis
Automated capability determines the appropriateness of the normal distribution and automatically presents alternative distribution fits or transformations.
Interactive Table Builder
Interactively explore relationships between variables and build meaningful descriptive statistics tables using the graph builder’s drag-and-drop interface and live preview.
Utförliga visualiseringar
Interactive Pareto Chart in Graph Builder
Graph Builder now includes an interactive Pareto Chart tool to identify features like defects to prioritize or the characteristics that contribute most to an outcome.
Enhanced Graph Editing
Interactively customize results with the new graph editing features includes guidlines show/hide gridlines at major tick positions, add reference lines, and Y-value data labels.
MINITAB ANALYTICAL SOLUTIONS
Kontakta oss för mer information om Minitabs produkter.
By providing your details, you agree to them being shared with us and our third-party partners, which may be located inside or outside of the European Union (in such case, we will use appropriate legal framework to operate data transfers), and for marketing purposes.


